After a month of shocks to stock and bond markets throughout the world stemming from daily surprises about trade wars and tariffs, it seems a growing share of voters previously interested in seeing Trump stick it to the same "others" they also like to hate have learned one of the easiest lessons in economics. Tariffs aren't imposed on or paid by foreign sellers of goods. Tariffs are imposed upon and paid by those BUYING the imported goods. In other words, Americans.
That's an important lesson to master when voting in federal elections for control of the White House and Congress. However, it's not the only lesson that should jump out at the public. To understand the bigger picture, it's useful to formulate a picture that shows how goods and money slosh around between actors in the larger system. It's also important to consider the proportion of spending on goods whose prices might be inflated by tariffs across different tiers of wealth in the country. This analysis truly conveys the damage that will be wrought by even modest hikes in tariffs.
The Basics of GDP and Trade
Gross Domestic Product (GDP) is a statistic used by economists to reflect the total value of activity in an economy over a year. In its simplest terms, GDP consists of the value of all goods and services created within an economy. In the United States, GDP is the sum of the dollar value of all goods and services created by government, business and households. Ignoring subtleties about production in advance of consumption, generally speaking, "production" is considered equal to "consumption" so statistics on spending across the government, business and households acts as the best proxy for measuring GDP.
Foreign trade adds complexity to this model and illustrates why the assumption of production equaling consumption is not strictly true. Imagine the following circumstances:
- American workers physically create $1 billion of goods and services purchased within the US
- American consumers also purchase $100 million worth of goods imported from Japan
- American workers produced zero goods sold overseas
In this scenario, total SPENDING in the US for the term was $1.1 billion but net exports were (-$100 million) so GDP for the period was $1 billion.
Imagine instead that the circumstances were these:
- American workers physically create $1 billion of goods and services purchased within the US
- American consumers also purchase $100 million worth of goods imported from Japan
- American farmers sell $200 million of wheat to Japan
In this second scenario, total SPENDING in the US for the term was $1.1 billion but net exports were (+$100 million since exports totaled $200 million and imports totaled $100 million ) so GDP for the period was $1.1 billion.
Visually Depicting GDP and Trade
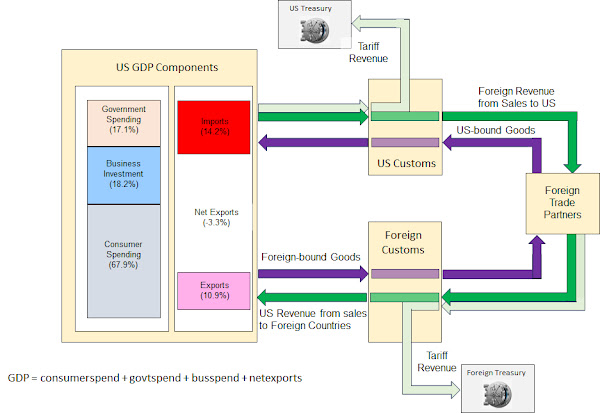
The relationship between domestic GDP and all foreign trading partners can be visualized as a series of pipes between any given country and all of its trading partners. Some pipes carry goods being exported OUT of the country. Other pipes carry sales revenue being collected from the foreign buyers into the country. Each country operates a customs enforcement process which not only prevents banned goods from entering but also collects any tariffs applicable to the arriving goods. But who is paying those tariffs?
The diagram below makes it clear any tariff imposed on incoming goods is paid by the domestic PURCHASER, not the foreign shipper. The dark green arrows represent "normal" market prices paid for the good that reflect the "intrinsic" value of the good itself as best reflected by market mechanisms. The light green arrow represents any additional tariffs being collected for the imported goods. The extra tariffs are collected by the IMPORTING government and flow to the IMPORTING government's Treasury department equivalent.
Secondary Impacts of Tariffs on Wealth Inequality
The subtle point not being properly emphasized in coverage about the Trump trade war stems from the impact tariffs have on wealth and wealth inequality. Understanding that impact starts with understanding one key aspect of tariffs.
Tariff revenue is just like tax revenue to the government. Tariffs ARE taxes.
This fact is crucial to understand because it affects how politicians are viewing TARIFF policies as part of TAX policies affecting spending and borrowing decisions.
Imagine the illustration above without the light green arrows reflecting additional tariffs being collected. That combination of flows is GDP. The total value – emphasis on the word VALUE – of goods and services being produced in the economy. When tariffs are imposed upon imported goods, they don't change the VALUE of that incoming good to the purchaser. The tariff is merely extra cash leaving the purchaser's wallet that is NOT compensating the seller for the VALUE delivered. The tariff is being paid to the purchaser's own government who is gating the transaction until the tariff is collected.
Here is a key point... Tariffs paid to the US Government ARE included in GDP statistics. They are tracked in a component called TOPI (Taxes on Production and Imports). In 2024, the TOPI component totaled $1.968 trillion for the year or about 6.6 percent of GDP. However, categorizing the amount paid in tariffs within a component tracking "value" doesn't reflect physical reality, it is merely an accounting decision to make GDP components easier to extract from public and corporate statistics.
In this closed system, if tariffs paid aren't truly part of "value", where is the cash for the extra cost in the light-green stream coming from?
The extra cash for tariffs are being withdrawn from the existing accumulated wealth of those purchasing the imported goods subjected to the tariff. Tariff charges are literally a transfer of wealth from purchasers to their government. Now it becomes crucial to understand what the government is doing with that tariff revenue.
In the case of the American government, since tariff revenue spends just like income tax revenue, the Trump Administration and Congressional Republicans are simultaneously betting on increased tariff revenue AND promising to extend in time existing tax rate reductions in place on the highest income tax brackets. This combination of factors will MAGNIFY the existing wealth discrepancy already causing fiscal and social problems in the country.
- Broad tariffs drastically increase prices paid by ALL households
- The top 1% of households spend a relatively small percentage of their income and cumulative wealth on purchases each year
- The lower 99% wind up transferring more of their existing wealth to the government
- The top 1% transfer relatively little of their wealth as tariffs to the government
- The government extends INCOME tax breaks which primarily benefit the top 1%
There are other feedback loops also influenced by tariffs that affect GDP by lowering the effectiveness of the Business Investment spending component of GDP which makes the economy less productive and slows the ability to increase production in future years. Modeling these feedback loops and illustrating the impact of proposed changes over time will be left as a potential analytical project for future commentary. As things stand today, this relationship between tariffs, GDP and wealth should be enough to wake up anyone with two brain cells.
If only we had anyone in power with two brain cells…
WTH